You are an anonymous user who can't edit RoboWiki.
Log in if you already have an account. If you would like to become an editor for the wiki, request an account.
Log in if you already have an account. If you would like to become an editor for the wiki, request an account.
Difference between revisions of "Members/Statistics"
Jump to navigation
Jump to search
| Line 8: | Line 8: | ||
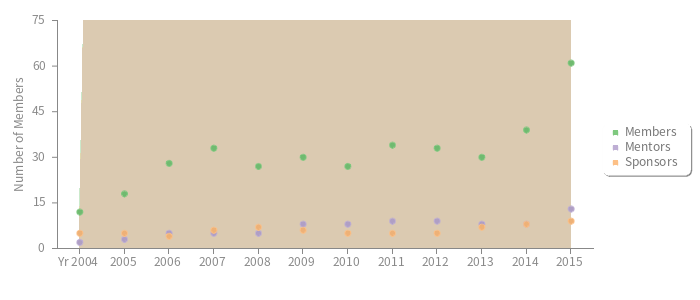
==Number of Members/Mentors/Sponsors Line Graph over Time== | ==Number of Members/Mentors/Sponsors Line Graph over Time== | ||
| − | <pLines size=700x300 ymin=0 ymax= | + | <pLines size=700x300 ymin=0 ymax=75 axiscolor=888888 ytitle="Number of Members" cubic filled angle=0 plots legend> |
,Members,Mentors,Sponsors | ,Members,Mentors,Sponsors | ||
Yr 2004,{{#ask:[[member of robotics in year::2004]] | format=count}},{{#ask:[[mentor in year::2004]] | format=count}},{{#ask:[[sponsor of robotics in year::2004]] | format=count}} | Yr 2004,{{#ask:[[member of robotics in year::2004]] | format=count}},{{#ask:[[mentor in year::2004]] | format=count}},{{#ask:[[sponsor of robotics in year::2004]] | format=count}} | ||
Revision as of 21:13, 14 May 2015
This page contains a few useful and interesting graphs that are informational.
All the data on these graphs are contained within articles in the wiki via Semantic MediaWiki's properties.
It is not possible to change the data in these graphs as a whole (i.e. change the number of members in one year from 23 to 26). To change the graphs, you must change or add the source of that data - the articles within this wiki. Most data in the graphs can be seen by looking at the members, mentors, or sponsors pages.
Note: For example, if I wanted to change the number of members in 2010 from 23 to 26, I would have to add three member pages with a year of attendance in robotics of 2010 for the system to show three more members on this page.
Number of Members/Mentors/Sponsors Line Graph over Time
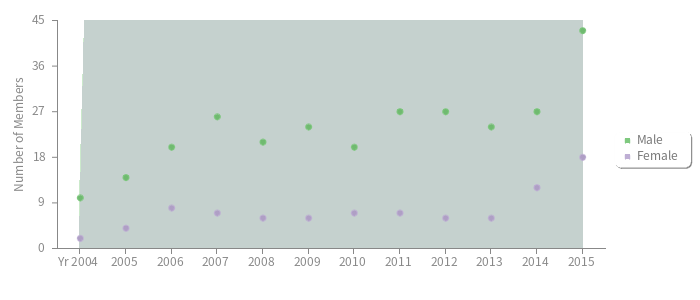
Gender Line Graph over Time
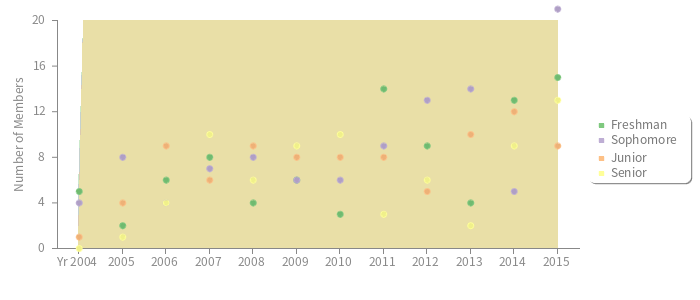
Year of Study over Time
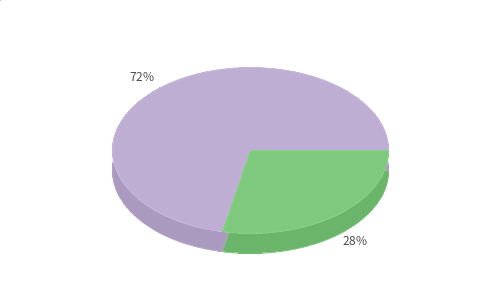
Member College Pie Chart
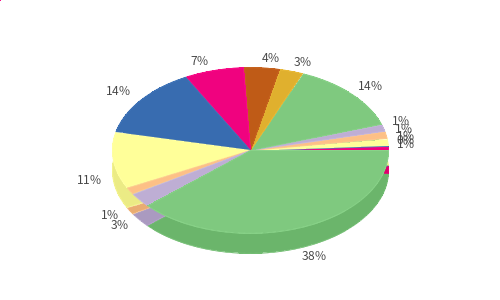
Note: If colors are too similar, keep in mind that the pie chart lists the legend from the top to the bottom starting at the bottom of the chart going clockwise (or negative).
Note: This pie chart is based off a known list of colleges that alumni attend, however if a member attends a college which is currently not present in this chart, it will not be added automatically. It must be done by hand.
Alumni Attending College Pie Chart
Note: Percent of non-college attending alumni may be inaccurate due to lack of data for some alumni. Use wisely with this in mind.